Case Studies
...to show you how to take Your Investor Marketing to New Levels
Case Study #1
ABOUT CLIENT
- Industry: Healthcare/Biotechnology
- Exchange: NASDAQ [Symbol: email us for full casestudy]
- Size: Small-Cap
CAMPAIGN
- Type: High-Level
- Purpose: Raise/Stock Split
- Ave Monthly Spend:Varies
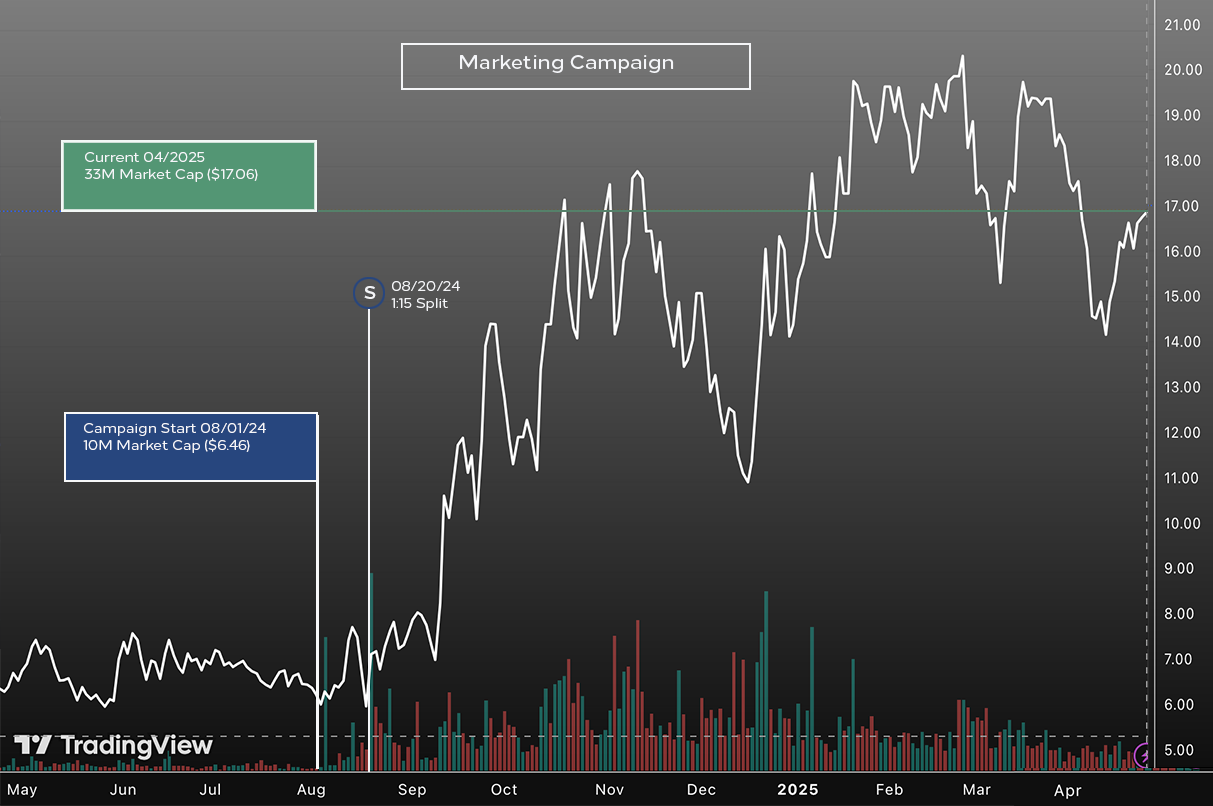
- Campaign Span: Aug 1, 2024 – Present 2025
ENGAGEMENT TYPE
- Service: Retail Investor Marketing
- Term: Ongoing Campaign
- Client: New Client
KEY METRICS
- Market Cap: Start $10.12mm / Current $32.67mm
- Average weekly volumes*:
3.2M
Shares Outstanding: 1.94M
Float: 1.3M
CAMPAIGN NOTES
- Company stock was at average $6.90 (+/- $6.40) for three months previous to the start of the retail marketing campaign.
- From 1,500 to 20,000 new investors
- Raised $20M
- Stock Split 08-20-2024 1:15
- Press Releases: 3x/mo
- Working closely with IR Firm on PR:Yes
CASE STUDY # 1 CAMPAIGN CHART
Case Study #2
ABOUT CLIENT
- Industry: Medical Services & Products
- Exchange: NASDAQ [Symbol: email us for full casestudy]
- Size: Small-Cap
CAMPAIGN
- Type: High-Level
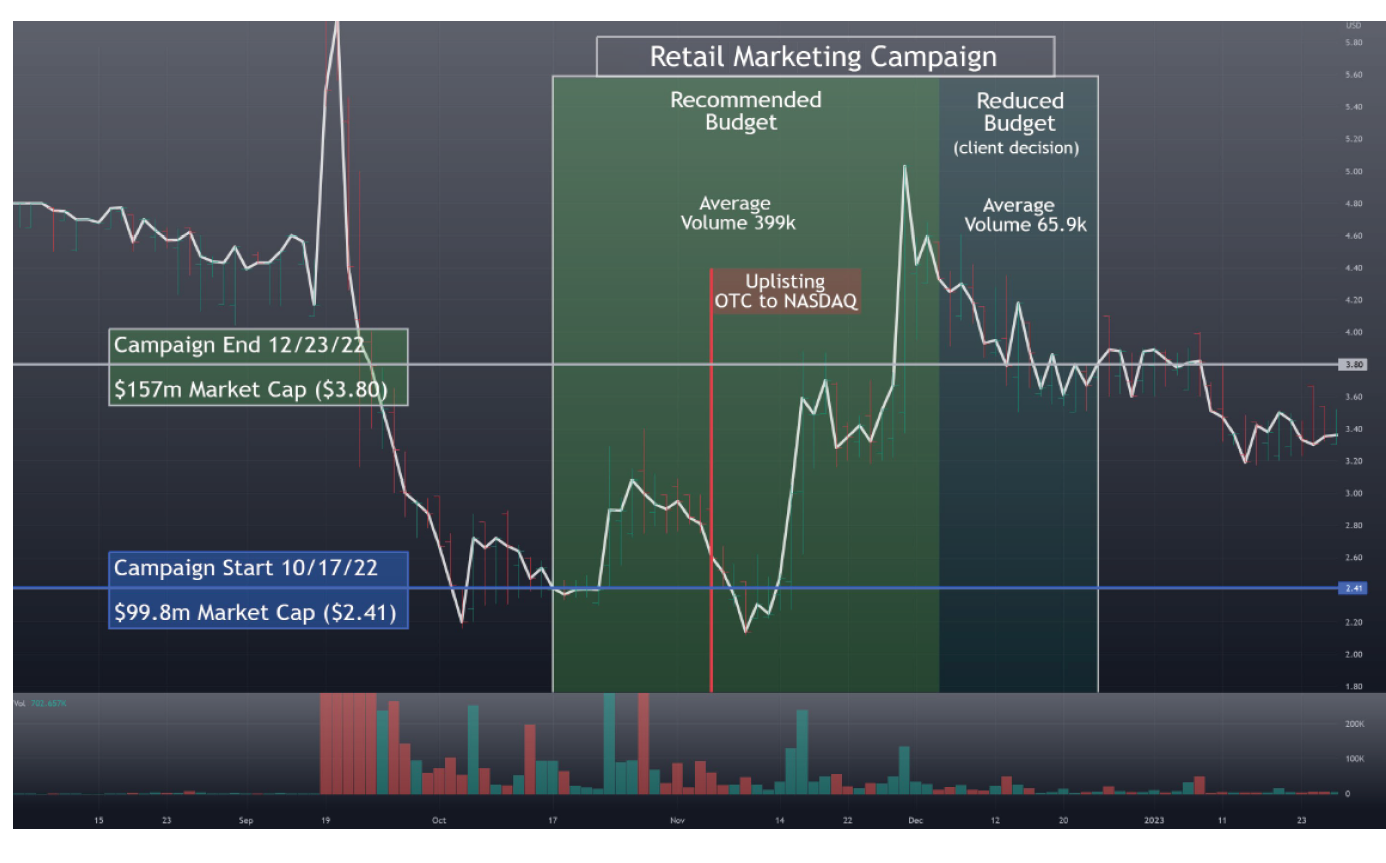
- Purpose: Uplisting (OTC – Nasdaq)
- Ave Monthly Spend:$250k ($50k–$100k per wk)
- Campaign Span: Oct 17, 2022 – Dec 23, 2022
ENGAGEMENT TYPE
- Service: Retail Investor Marketing
- Term: 4-month Campaign
- Client: Repeat Client
KEY METRICS
- Market Cap: Start $99.8mm / End $157mm
- Average weekly volumes*:
4-mo Pre: 124mm
During: 278mm
3-mo Post: 63k
Shares Outstanding: 37.89mm
Float: 13.4mm
*-Removed Single highest day from 4-mo. Pre & During Weekly Volumes
CAMPAIGN NOTES
- Retail Investor pre-uplisting preparation proved to affect unique views and marketing engagement significantly.
- Press Releases: 2x/mo., Low to Med Engagement
- Working closely with IR Firm on PR:No
CASE STUDY # 2 CAMPAIGN CHART
Case Study #3
ABOUT CLIENT
- Industry: FinTech
- Exchange: NASDAQ [Symbol: email us for full casestudy]
- Size: Small-Cap
CAMPAIGN
- Type: High-Level
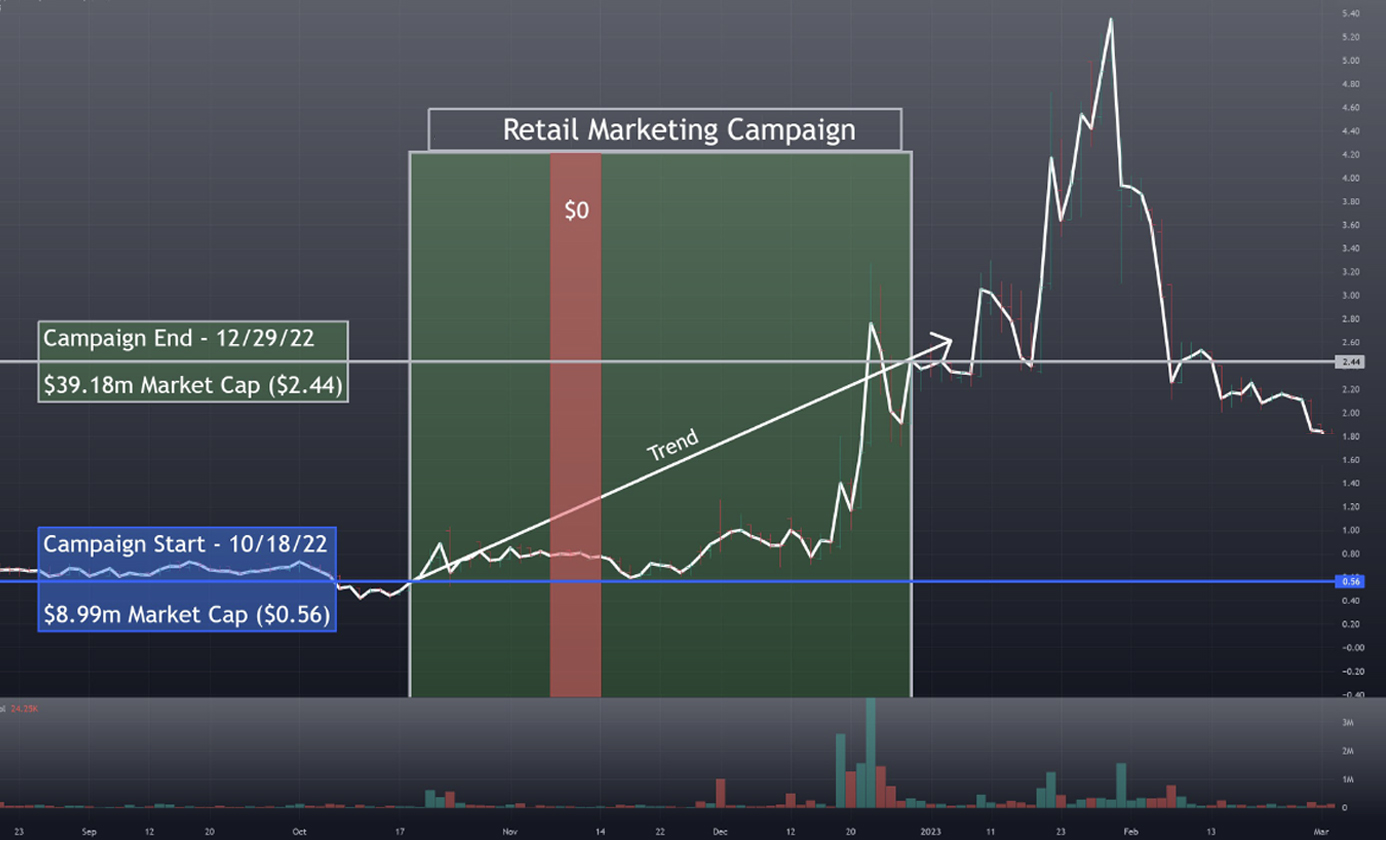
- Purpose: Pending Delisting (trading under $1.00)
- Ave Monthly Spend: $200k ($35k–$75k per wk)
- Campaign Span: Oct 18, 2022 – Dec 29, 2022
ENGAGEMENT TYPE
- Service: Equity Marketing
- Term: 3-month Contract
- Client: Repeat Client
KEY METRICS
- Market Cap: Start: $6.87mm / End $16.36mm
- Average weekly volumes*:
6-mo Pre: 15mm / During: 19.2mm
During: 278mm
3-mo Post: 63k
Shares Outstanding: 17.88mm
Float: 13.59mm
CAMPAIGN NOTES
- Company stock was at $0.60 (+/- $0.10) for four months previous to the start of the equity marketing campaign.
- Press Releases: 2x/mo., Low to Med Engagement
- Working closely with IR Firm on PR: Yes
- Social Sediment: Significant increase in Positive & Neutral comments, and in volume
CASE STUDY # 3 CAMPAIGN CHART